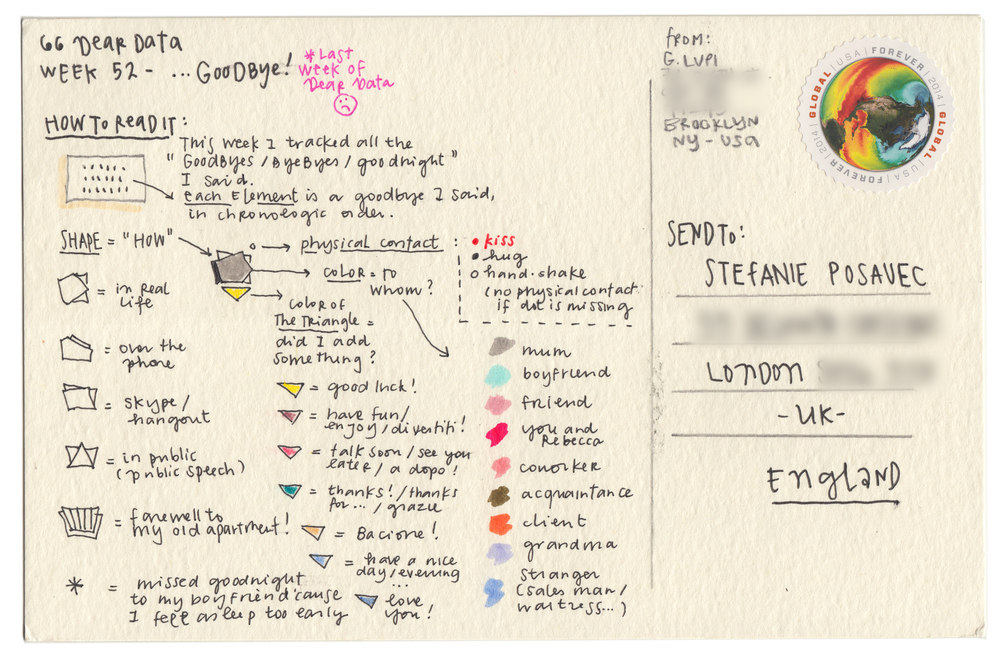
When I joined the Information Lab, the legend who is Tim Ngewna introduced the term "quantified self" to me. I'd heard of fitness tracking, but life tracking was a concept which was very new to me. Over the last 6-8 months, I've wanted to force myself to track something in my life - almost similar to the Dear Data & Dear Data 2 projects

When doing Dear Data 2, Andy Kriebel used a multitude of mobile applications to track something every week. For me, I didn't want to commit to something over just 7 days, and wanted a bit more data to play with. So my plan is to go through and track one thing every month and visualise it and see what I find out. I'll be using 28 days of data (because, well, February)
This month, using a IFTTT (if this, then that) recipe to log the temperature of where I am to Google Sheets every morning. So what I've done with this data is a really simple visualisation. The fields I had were;
- Condition (cloudy/sunny/rain etc)
- Sunrise at
- High Temp
- Low Temp
- Temp
Now, what's interesting (I think) is when I was getting this data logged, I wanted to look at the "sunrise" field - but when I got to looking at the data and testing, the story which popped out which I imagined would be interesting was to make a simple visualisation to show simply the temperature. Check out the image below.
Given it's a temperature visualisation, I used a "thermometer" style chart, with the dot representing the daily low, and the Gantt showing the difference between high and low. The label itself is the simple daily temperature.
When I finished the visualisation, I created the key (top right) - I love stuff like this, and I've been a huge fan of Andy Kirk's "the Little of Visualising Design" series. The key is a really nice simple visual way of understanding how to read the chart. It saves on text, and when done will can be super brief - Let me know what you think about my effort!
After this point, and adding the text - I sat back and realised I had a lot of blank space at the bottom of the viz, so I added a few headline figures to add a bit more simple information to the viz.
Please feedback on this visualisation; next month (or rather this month), I am tracking the amount of times I consciously look at a clock/the time.
Check out the visualisation itself on Tableau Public here.
EDIT:
Since posting this blog, I sought out feedback from the excellent #DS4 group and they gave some great ideas on how I could improve it. Find the changes on the Tableau Public here! (and check out the image to compare below)
The feedback they gave was that the current temp (ie. the temperature at the point at which IFTTT was sending me the update) was confusing as a concept. Instead, I've now changed the labels to be the high and low, with the current temp not even used.


