I'm still commuting to London, and this morning while scrolling through Twitter, I wanted to know two things; one, how many points does it actually take to win the league (For Leicester [who will inevitably, probably regress over December], Arsenal and Manchester City) and two, what's the magic number that José Mourinho has to help his Chelsea team achieve to fight off relegation.
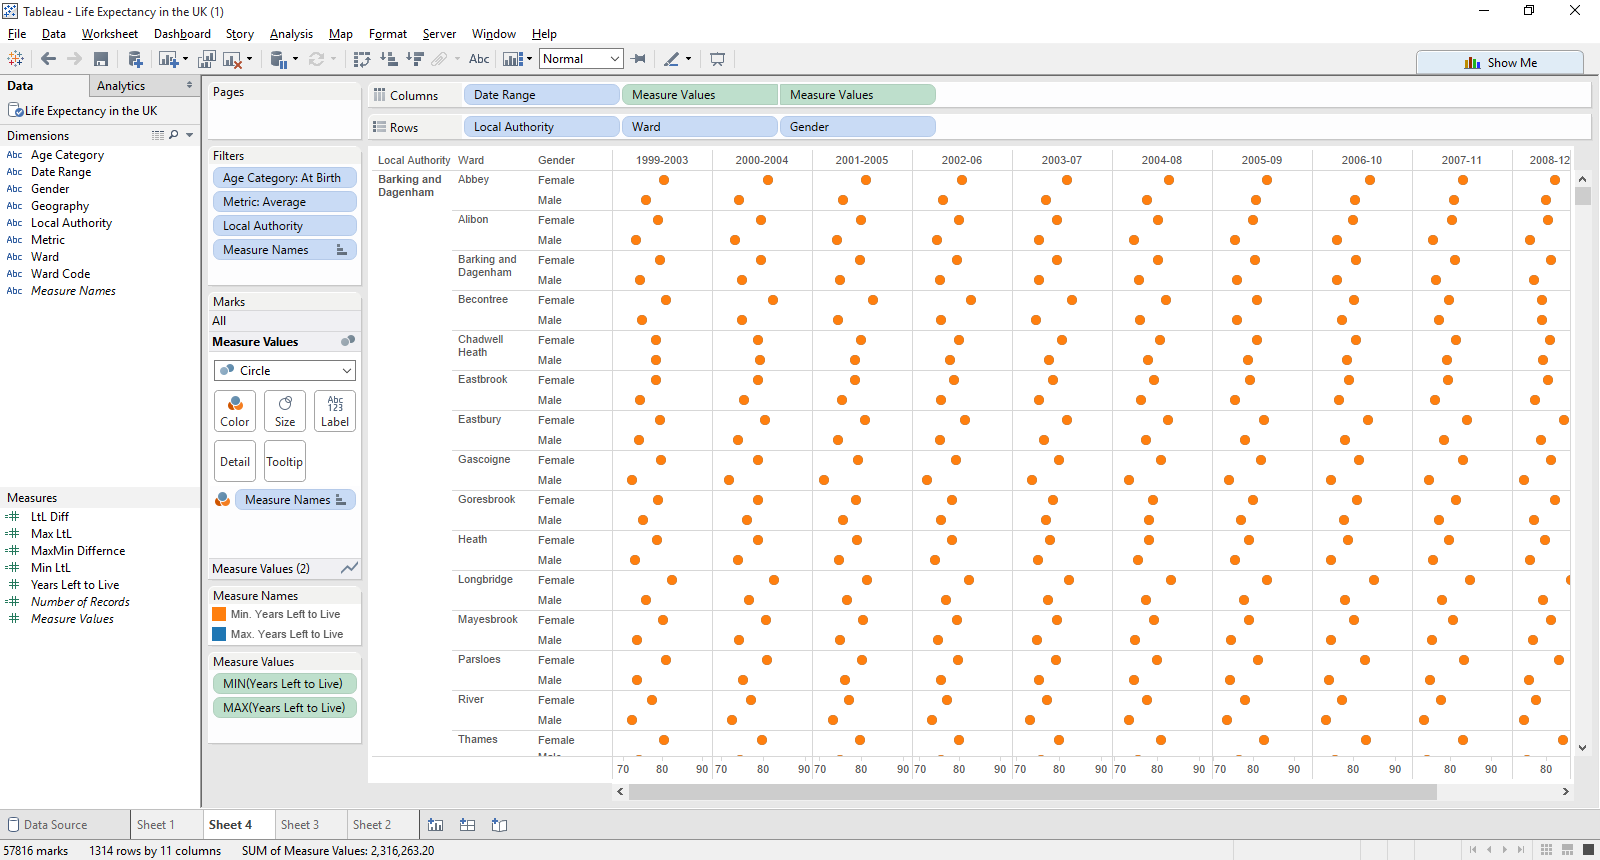
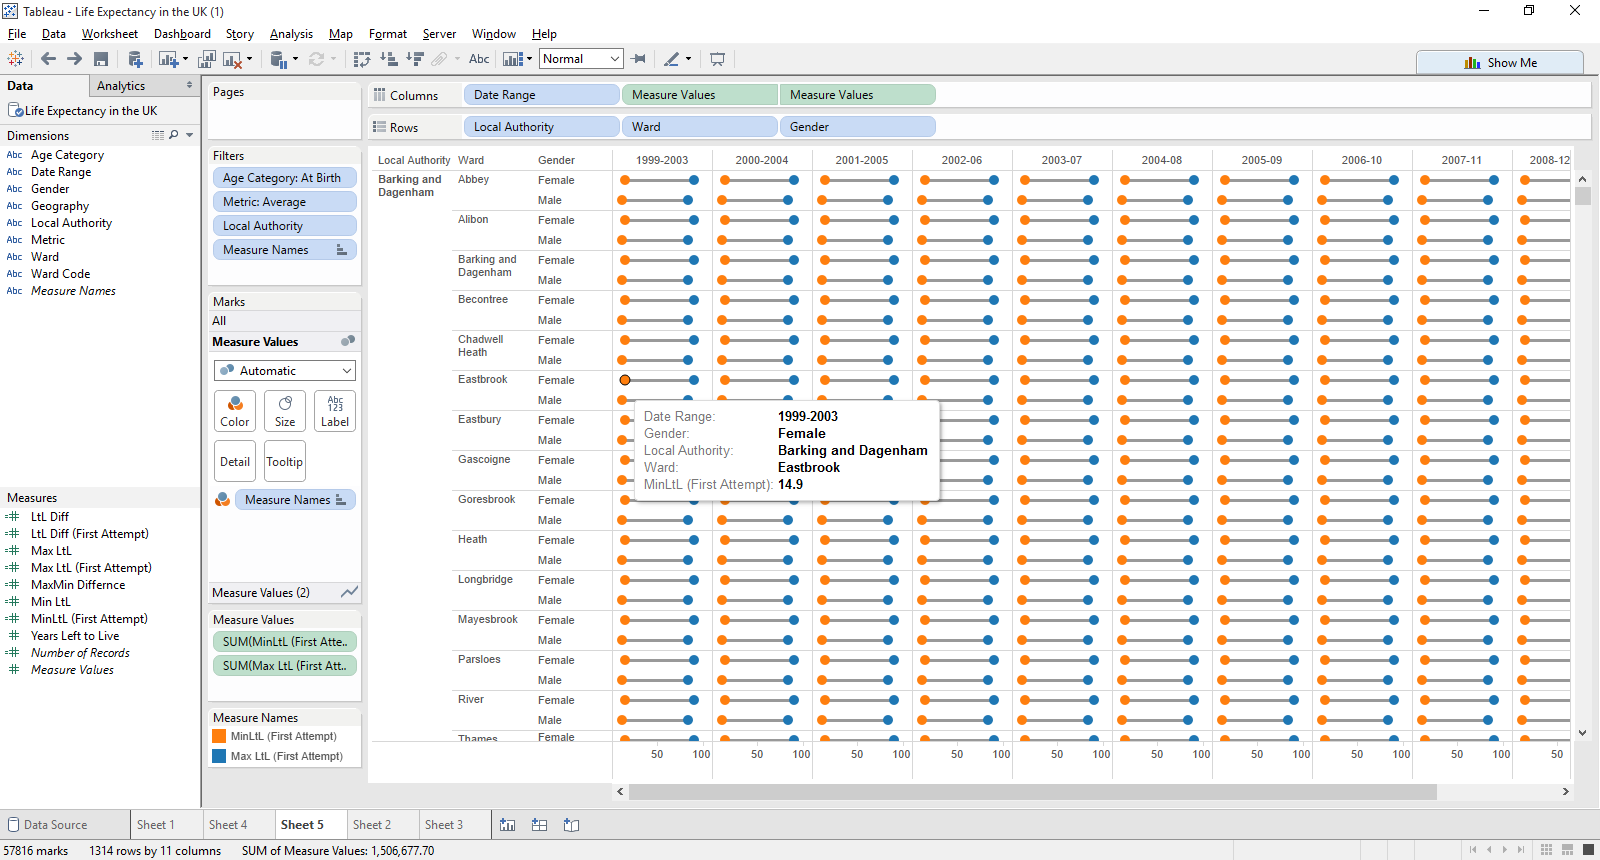
So, of course, I set about visualising it! Grabbing the data from statbunker.com, I expanded my view to look at 1st place, 4th place (to qualify for the Champions League) and 17th place (escaping relegation). It's a really simple visualisation, and instead of using the native box plot in 'show me', I created this with the help of the Analytics pane. I'll do a full write up on the how-to later.
Check it out below and let me know what you think!


